Analytics and Content Analysis
A semester-long road trip takes you and your class to many places. Each place along the route produces data on how the students are performing, gives you a chance to review their work, if so desired, and begins to paint a clearer picture of the final destination, the overall course grade and analytics.
In this section, we first analyze each destination or assignment. We also cover how to interpret all of the course data and bring the semester together, by the numbers.
Stopping Places: Assignment Analysis
When an assignment completes, there are four tabs within the assignment, which will paint the picture of how your class performed. Some instances, the overall class performance is visualized. In other areas, each group and each individual student’s performance can be understood.
Peer Group Ranking
This tab loads by default when you as the instructor opens an assignment. The first data to observe is the Response Activity.
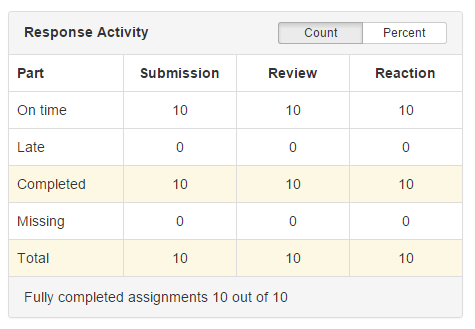
This table shows how many students completed the entire assignment and how many completed each assignment, either on time or late.
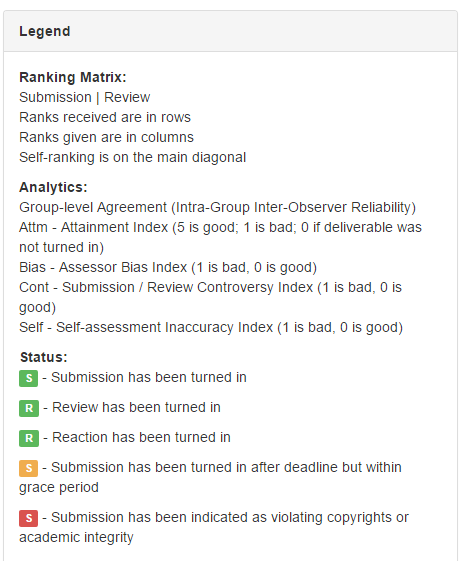
To the right, you find the Legend, which helps to explain the Ranking Matrix, Analytics and the Status of each phase for each student.
As you scroll down the page, the Ranking Matrix appears for each peer group.
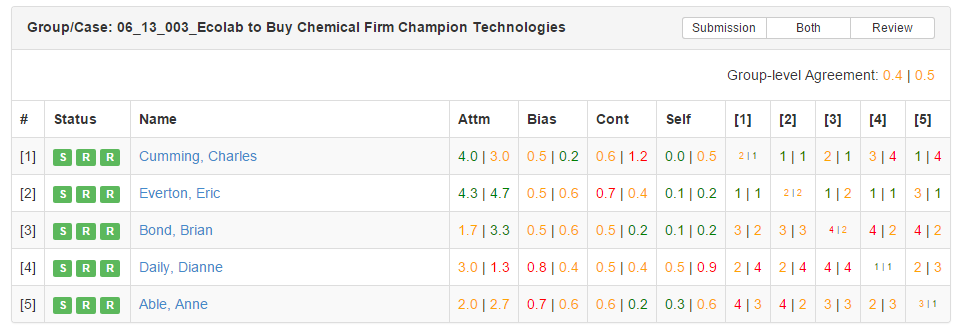
The ranking matrix consists of rows containing each student within the peer group, the status of each assignment phase, their raw Analytics score and how they were ranked by each of their peers. You also find the group level agreement, this statistic shows how well the group agreed or did not agree during their Review and Reaction phases. Each ranking matrix can be viewed by the Submission only, Review only, or both Submission and Review. The Ranking Matrix serves as an overview of each group’s performance on the assignment.
Rating Visualization
This tab shows an overview of class performance for Reviews and Reactions both Received and Given. The legend helps to explain the graph. Basically, each student is a circle. The center of the circle shows the average of the ratings, given to or received by the student. The size of the circle shows the range of the ratings. A more dense color pattern shows a higher frequency of ratings given in a particular area. Think of the SLIP Slider when interpreting this data.
Benchmark Visualization
The Benchmark Visualization seen by instructors is reminiscent of the visualization seen by students in their Course Summary for each assignment, with one addition. You, the instructor can see the names of each student. To students, this appears as ‘Peer 1’, ‘Peer 2’, etc. Here, you see the Benchmarks or rankings, given to each student and received by each student from their peers. By hovering over a Student’s name, you see the number assigned to the left of that student’s name highlighted across his or her bar and the rest of their peer’s bars. This shows the ranking they gave to each of their peers. Simply look at each student’s bar to determine the rankings given to them by their peers.
Content Analysis
The Content Analysis tab contains the majority of the data and provides a comprehensive look at each student and peer group. We will spend the next few miles thoroughly discussing this section.
Peer Groups: Convertible Tops
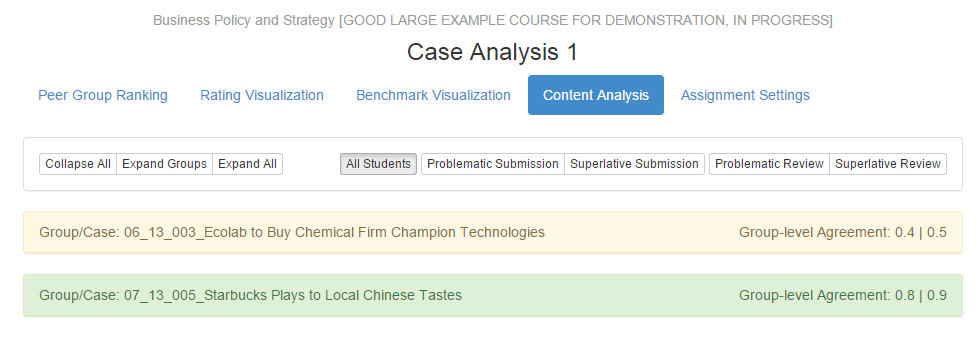
The Content Analysis tab loads in the default view with each peer group clustered together and expanded to view the student’s names and attainment indices across three categories.
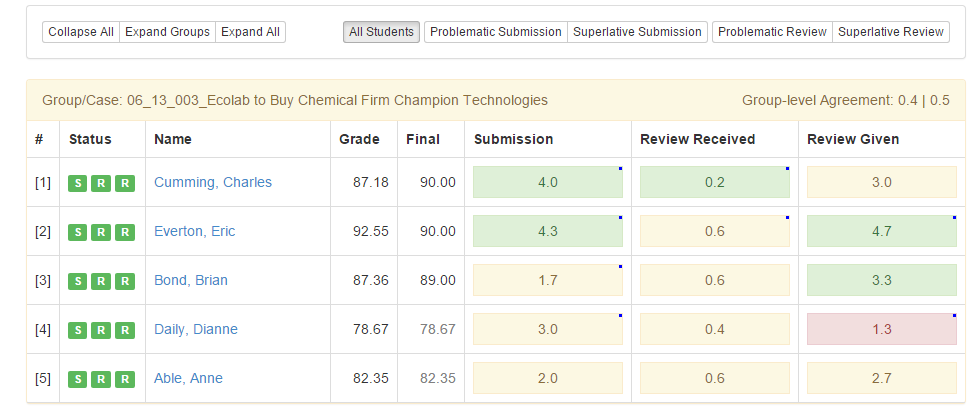
The color of the ribbon containing the Group/Case name and the Group-level agreement indicates the performance of the group on the assignment. It is based upon the Group-level agreement statistic. A green ribbon indicates a high-level of agreement among the group in both the Review and Reaction phases. A yellow ribbon indicates that at least one of the group-level agreement statistics is in the medium range. A red ribbon indicates that there very low agreement occurred on at least one of the phases.
Group-level agreement measures the aggregate consensus of how a group viewed each other’s work.
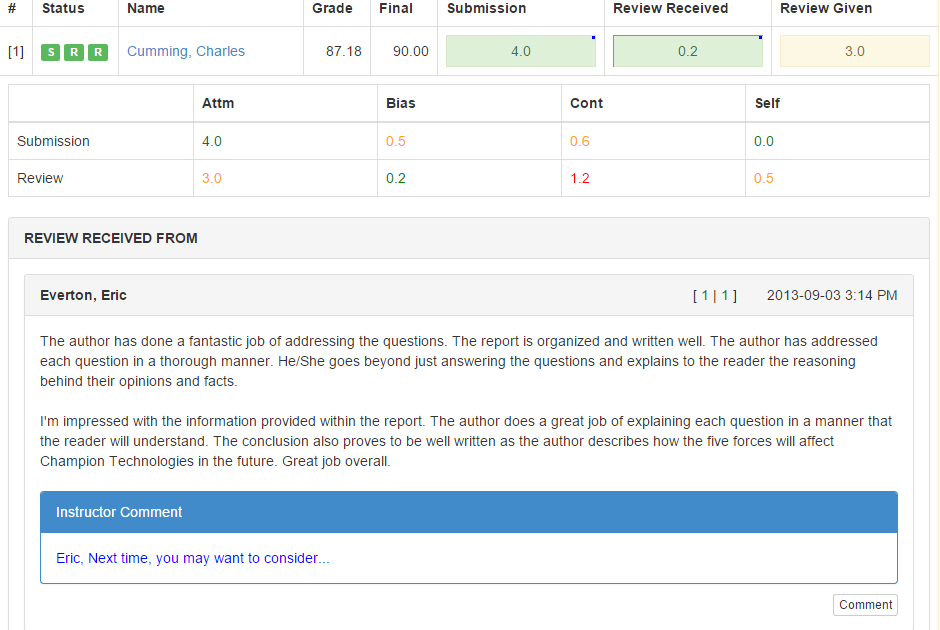
From left to right, let us talk about the columns. The pound symbol gives the peer number assigned to each peer in the peer group. The three blocks in the Status column indicate when or if a student turned in their work on each phase. Green means on time, yellow indicates late, and grey indicates a failure to turn in anything. The Name column contains the student’s name as a clickable link. The link opens the student’s consoles, so that you may see exactly what the student sees.
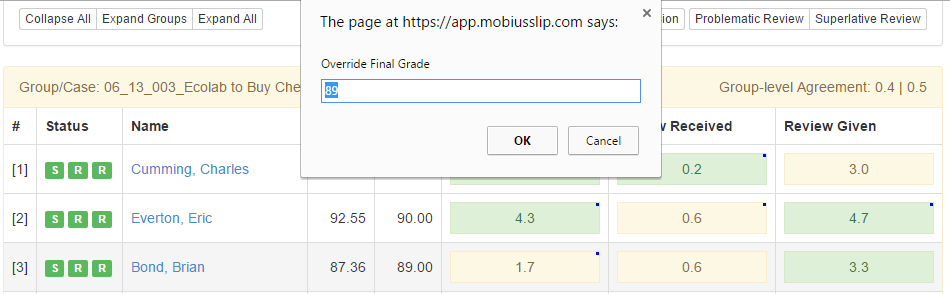
The number in the Grade column is the grade assigned by Mobius to the student for their work on the assignment. This grade is calculated based on the criteria chosen during the assignment setup process and the algorithm that the system runs to compute the Analytics. Initially, the number in the Final column matches that of the Grade column. If, upon review of the student’s entire work, their Submission, Reviews Given and Reviews Received that they deserve a grade different from the one calculated by Mobius, you may edit this number by clicking it, typing in the desired score, and clicking [OK].
The next three columns contain a colored block with a number in the block. These are buttons that, when clicked, expand to show the student’s Analytics and the respective content. For example, clicking on the Submission block shows the student’s Submission. The number indicates a different analytic per column. For Submission, this is the Attainment analytic for that student’s submission. The Review Received is the Bias Analytic of the Review. Bias of Reviews measures the student’s ability as a reviewer. The Review given is the student’s Attainment analytic on the Review phase. For more information on Analytics, refer to the Diagnostic Machine: Understanding the Analytics section. Each button is a toggle switch. You may expand more than one at a time.
Much like a convertible top on a car, the peer groups may be compressed or expanded further. The default view above, is the Expand groups feature on the upper left-hand side. Collapse All displays each group as a ribbon with the group or case name and the group-level agreement score, like so.
The exact opposite of this concise overview is the Expand All feature. This feature expands each group and subsequently expands each student as well. The view allows for you the instructor to see all of the content from each group and student at once. Please note that for large class sizes, it will take a minute or two to expand this page to the fullest extent.
Groups, students and student content can also be expanded or collapsed in any order manually. For example, you may collapse all groups and open them each individually. From the individual groups, you may then open a student’s content from each of the three categories, Submission, Review Received and Reaction Received, as discussed above.
Air, Oil and Student Filters
Just as with any vehicle, filters improve the performance of the vehicle. In the content analysis section, you may filter students to focus in on certain areas, as to improve the overall performance.
Filters are located on the right-hand side at the top of the Content Analysis page.

The default filter is All Students, which shows every student when in the Expand Groups or Expand All views.
The other filters allow you to view the students who had a Problematic Submission or Review. It also allows you the opportunity to view Superlative Submissions and Reviews.
Grade Talk: Comments
When you, the instructor drill down to view the content turned in by students, not only can you read the content, but you may respond with feedback of your own. To learn about viewing student content, refer to Peer Groups: Convertible Tops.
Submission Comments
With a student’s submission open, scroll to the bottom of the submission. You will find a ![]() . The Instructor Comment box opens.
. The Instructor Comment box opens.
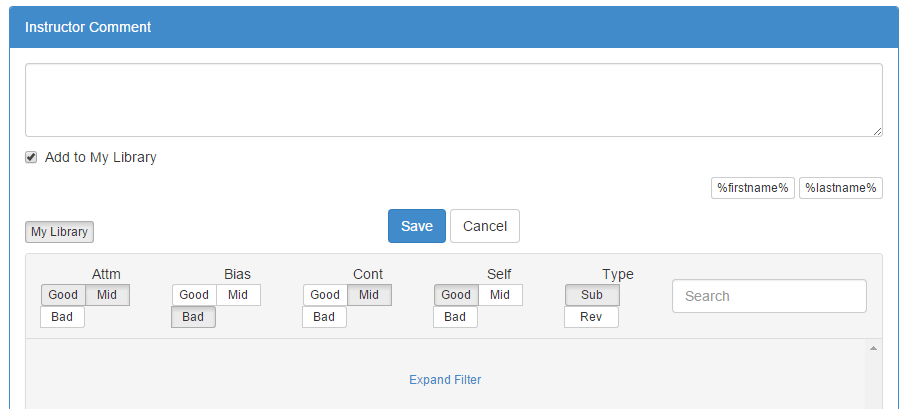
The text box at the top allows you to type a comment to the student. The placeholders ![]() , may be inserted. This is especially helpful for a comment you wish to reuse. You may save a comment to your library by leaving
, may be inserted. This is especially helpful for a comment you wish to reuse. You may save a comment to your library by leaving ![]() checked when saving the comment. Once you add a comment and click Save, the comment is visible to the student on their Summary page. The block on which you click to expand the student content now has a blue dot in the upper right-hand corner. This is helpful if you grade via filters or you have been grading at a rest stop and need to move on down the road before your next grading session. This means allows you to know which students you have commented on their work.
checked when saving the comment. Once you add a comment and click Save, the comment is visible to the student on their Summary page. The block on which you click to expand the student content now has a blue dot in the upper right-hand corner. This is helpful if you grade via filters or you have been grading at a rest stop and need to move on down the road before your next grading session. This means allows you to know which students you have commented on their work.
The ![]() button opens the saved comments library.
button opens the saved comments library.
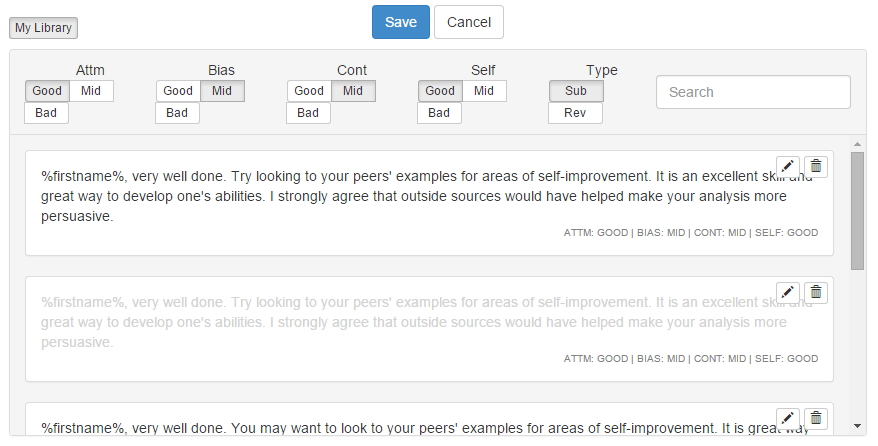
Comments are filtered by the parameters listed under Attainment, Bias, Controversy, Self-reflection and Submission or Review. When you enter a comment and save it, Mobius SLIP automatically saves it filtered base on those parameters. Then, the next instance of a Submission with the same parameters, Mobius suggests the same comment. You may choose to use this comment again as is, or you may choose to use it with edits.
To use a suggested comment, click on it. Mobius enters it into the text box. You may then add or remove part of the comment if necessary. Clicking multiple comments, inserts them in chronological order to which they were inserted. If you wish replace the inserted comment, first delete all text in the textbox and then insert the desired comment.
Comments may be edited or deleted. To edit a comment click on the pencil, you may edit the content of the Comment. To delete a comment, click the Trashcan icon.
The list of suggested comments may be expanded by turning on more or different criteria at the top of the Library.
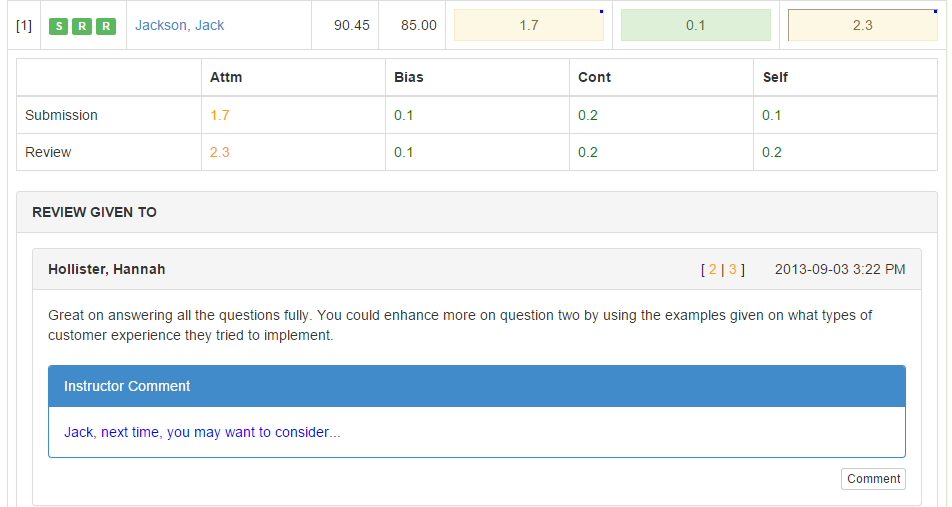
Review Comments
For Review Given and Review Received, you may also make comments. If you add a comment to a student in Review Received From, that comment will appear to the student whose review you are grading. For example, you may be on Student A, reading all of the Reviews given to them. If you then comment on Student Y’s review, it will appear to Student Y NOT Student A. It will also appear on the Content Analysis tab under Review Given To for Student Y. To Comment on Student A’s comment to their Peers, click on Review Given for Student A and leave the comments here.
There are all the measures for each visit along the road-trip. Let us now turn to the information on the entire trip; the course-wide statistics.